


澜起科技率先在业界试产CXL 3.2内存扩展控制器芯片
全球TMT-美通国际
·

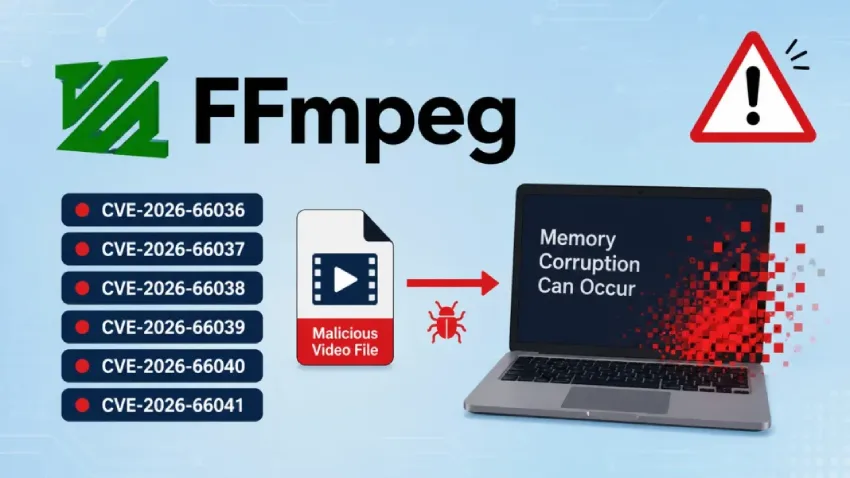
多个 FFmpeg 漏洞允许攻击者通过恶意视频文件破坏内存
实时互动网
·


AI 内存别只当概念看:它其实是状态管理问题
mongona news
·
Spring Boot RCE到内存马探索
像清水一般清澈透明
·
论如何优雅注入 Java 内存马
像清水一般清澈透明
·

即便是微软也无法让Windows 11在8GB内存上顺畅运行
The Verge
·


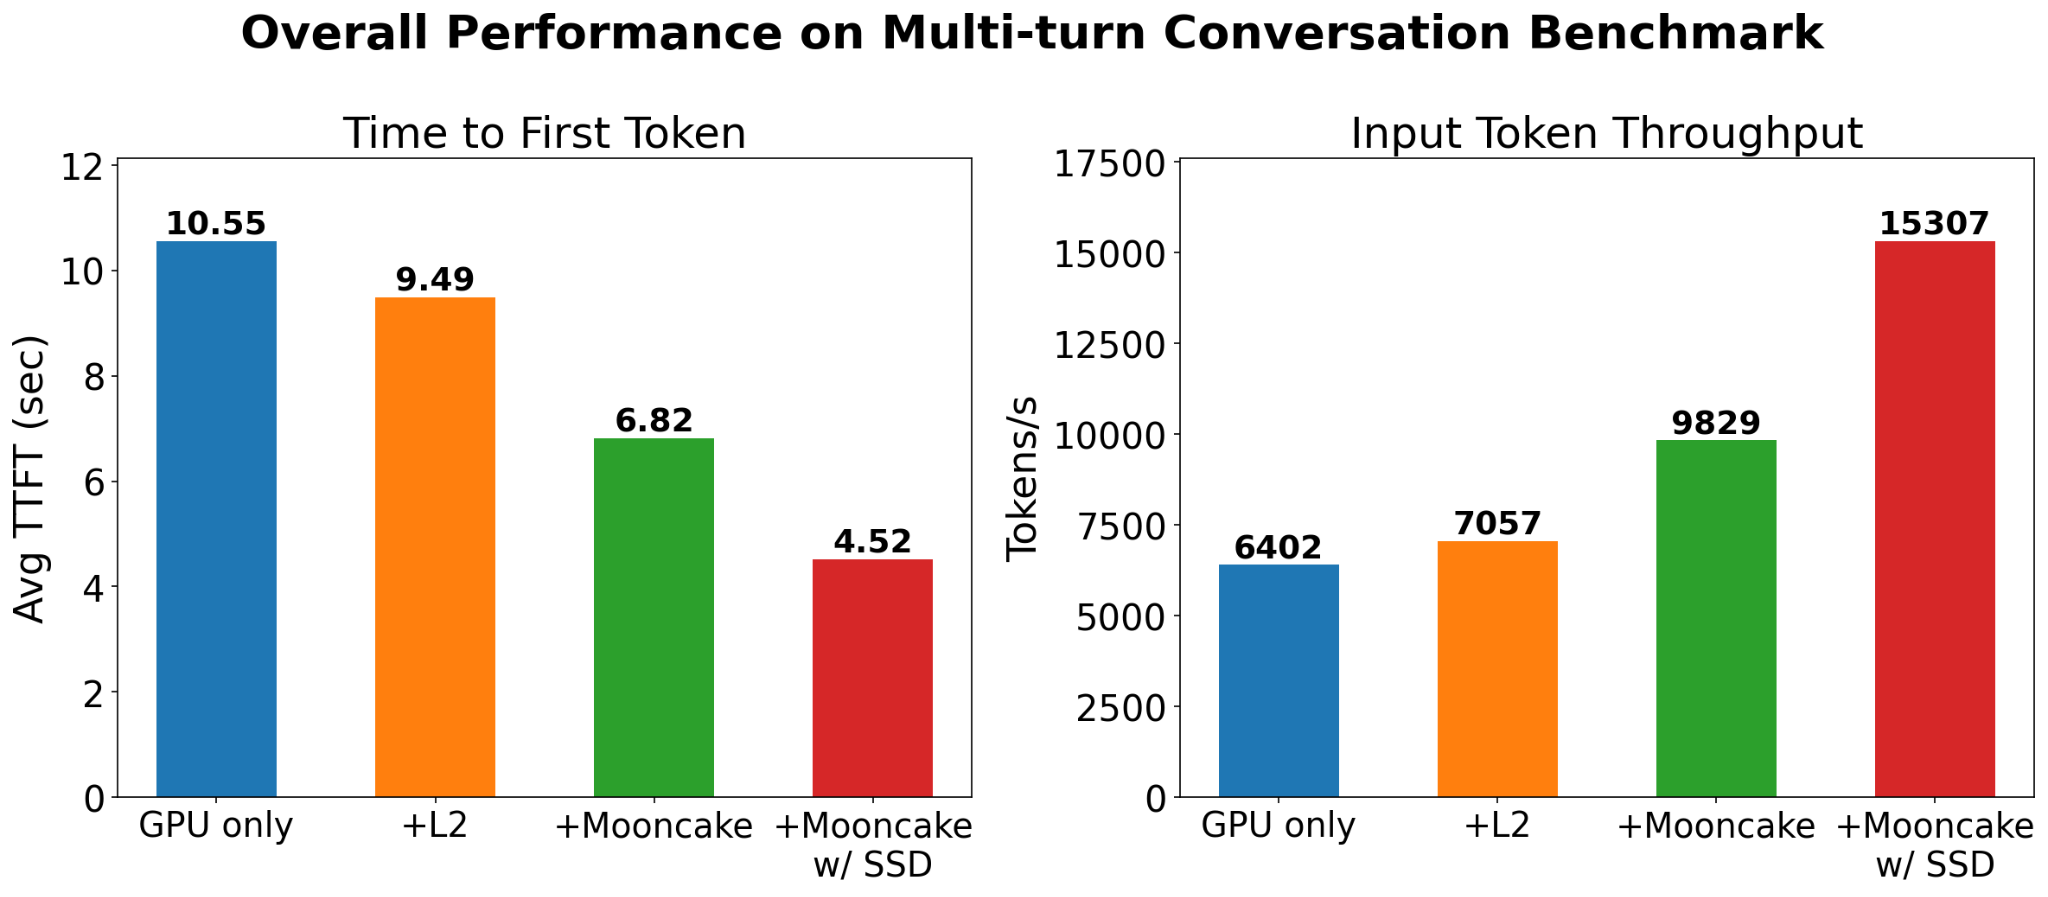
通过Mooncake SSD离线存储扩展KV缓存超越内存
Home | KVCache.ai
·
