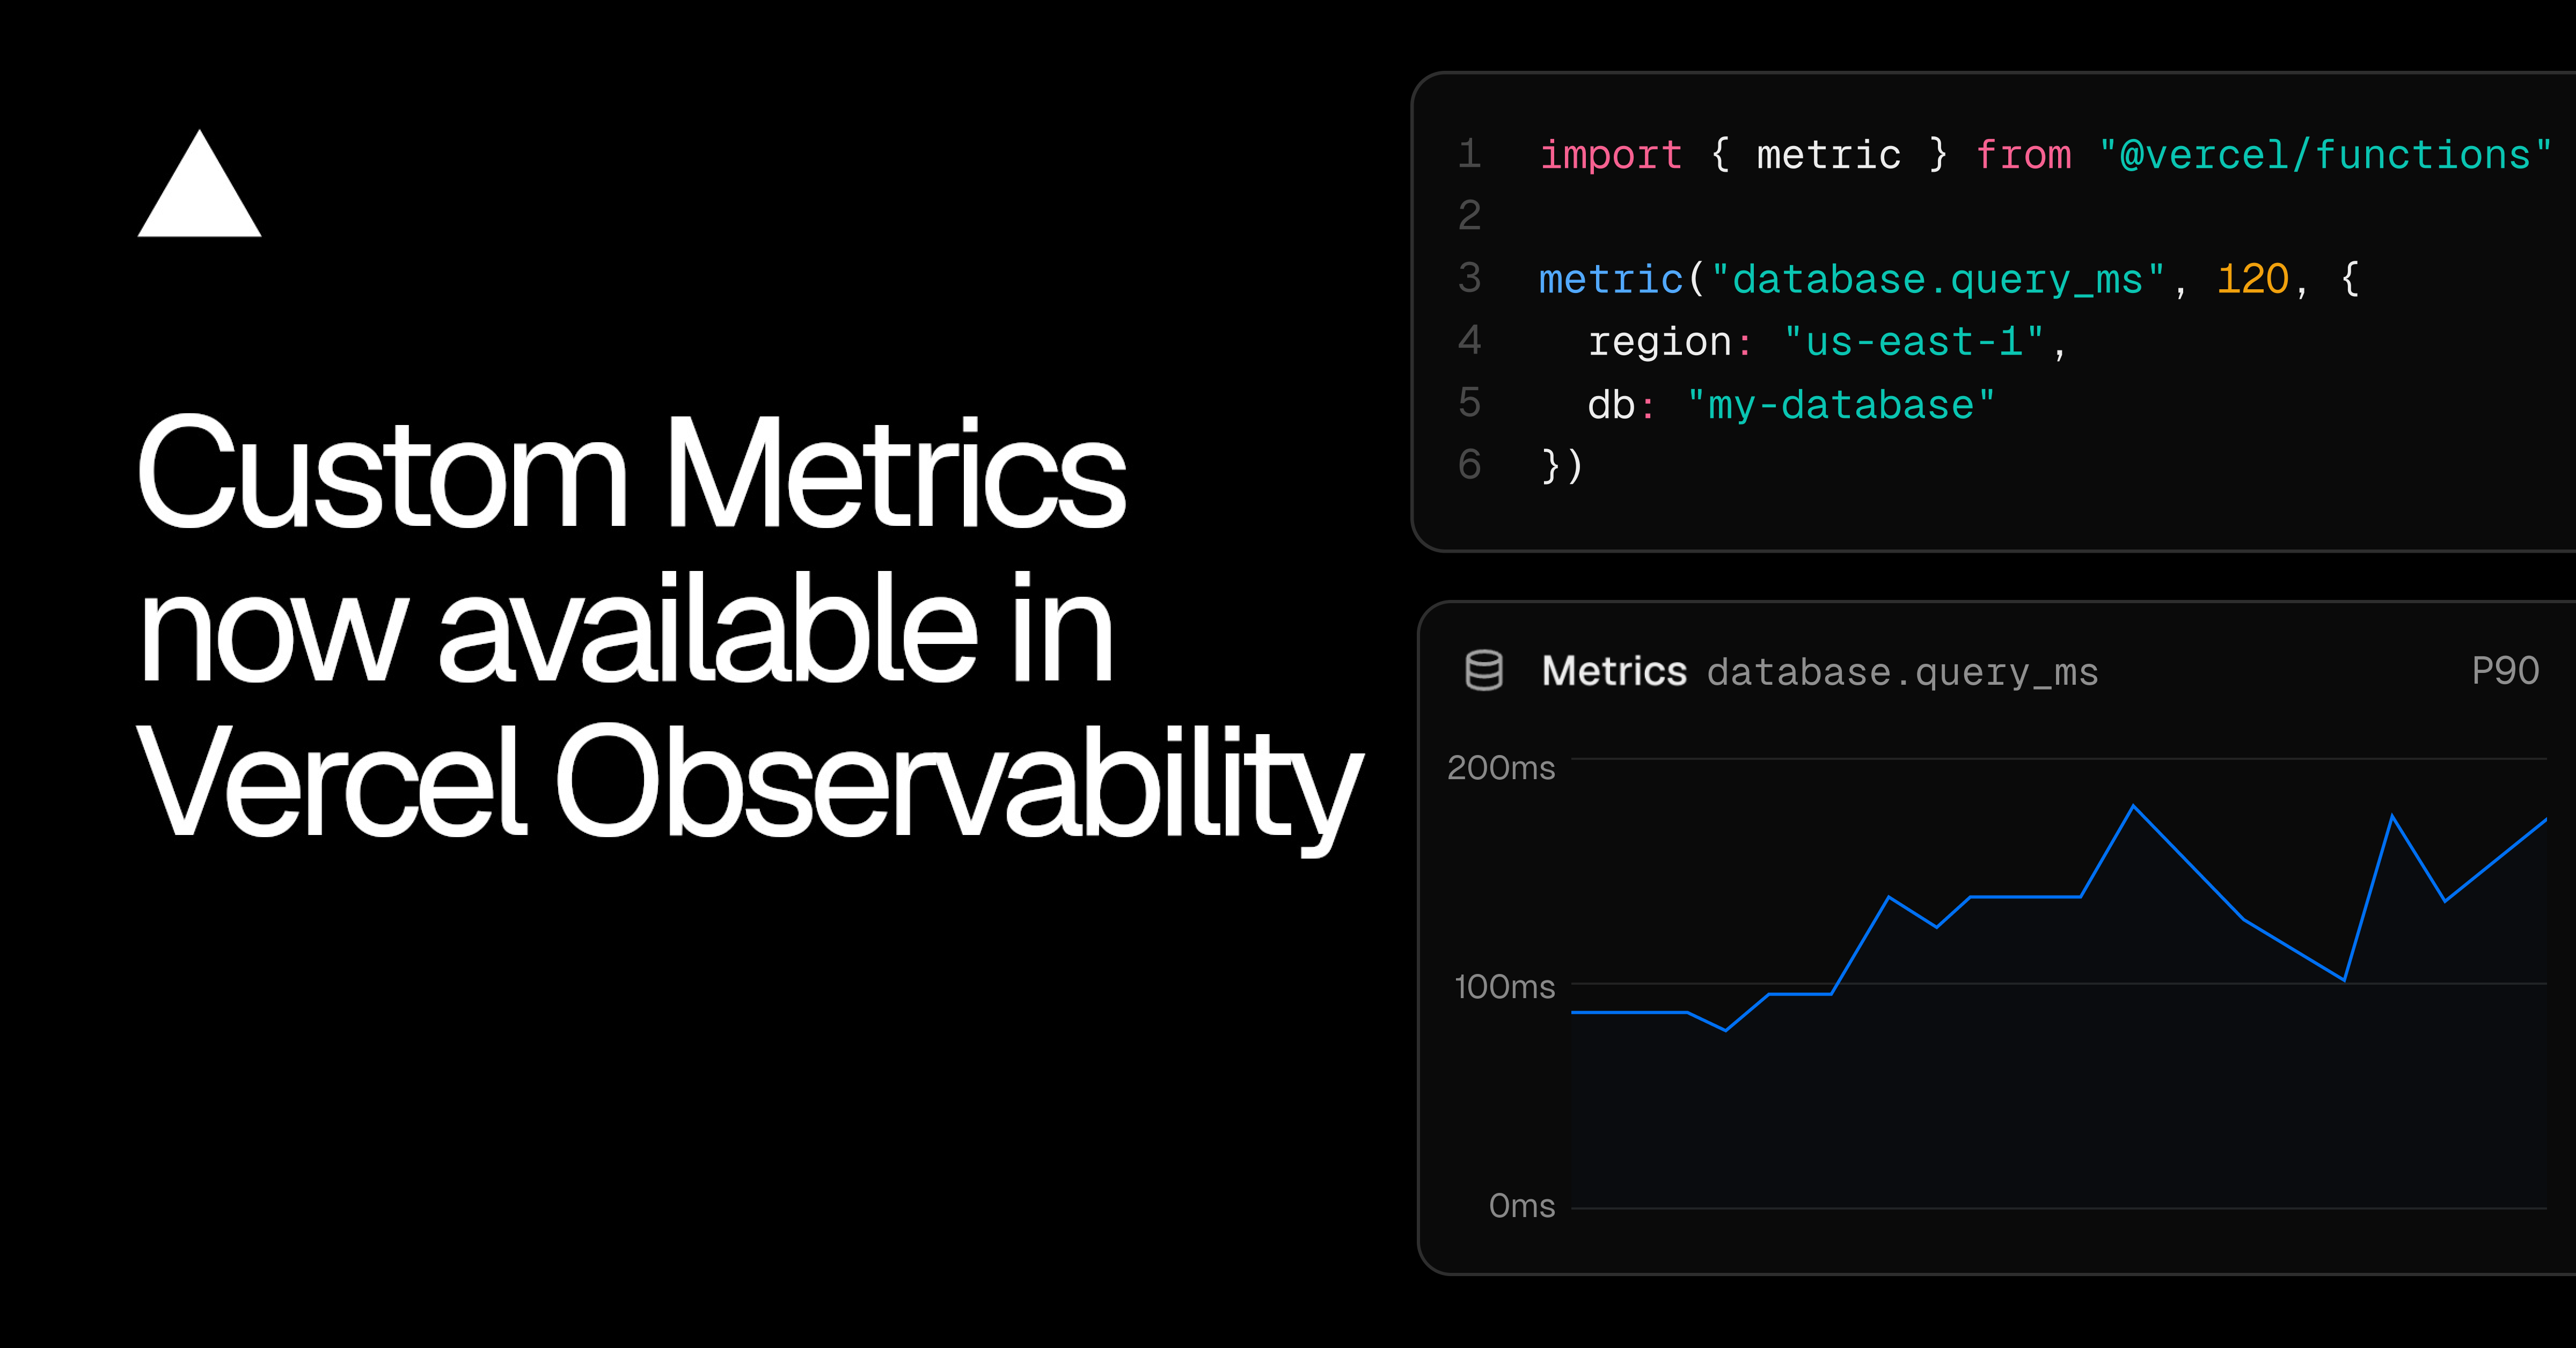
Vercel Functions 现支持自定义指标,通过 `@vercel/functions` 包的 `metric()` 函数记录延迟或业务事件,并附加属性筛选。指标可在查询构建器、笔记本和 CLI 中分析,自动包含部署和区域属性,按观测事件计费,适用于 Pro 和企业版。
Elastic Observability更新了指标定价,TSDS指标数据在Serverless模式下的价格降至标准的25%。此变更使Elastic的成本显著低于Datadog,节省超过50%。Elastic采用列式存储引擎,提升存储效率和查询速度,并且不对高基数指标收取额外费用。
OpenTelemetry has introduced a new "Blueprints" initiative aimed at reducing the growing complexity of deploying and operating observability systems at scale. By Craig Risi
eBPF is emerging as a preferred method for security observability over traditional user-space agents. By attaching probes directly to the Linux kernel's syscall interface, it provides consistent...
Autonomous AI agents break Kubernetes security assumptions with dynamic dependencies, multi-domain credentials, and unpredictable resource use. This article covers production-tested patterns:...
Wayne Bell and Dan Gomez Blanco discuss the architectural and cultural shift required to scale observability at Skyscanner. They share how moving to OpenTelemetry decoupled instrumentation from...
At GrafanaCON 2026 in Barcelona, Grafana Labs announced Grafana 13 with the new Loki Kafka-backed architecture at the ingestion layer and the AI Observability in Grafana Cloud to monitor and...
Observability must evolve with serverless, event-driven architectures. OpenTelemetry can decouple telemetry from vendors, letting developers emit consistent, high-quality data that explains real...
The MCP Dev Summit North America 2026, held on April 2-3 at the New York Marriott Marquis, gathered about 1,200 attendees. Hosted by the Linux Foundation's Agentic AI Foundation, discussions...
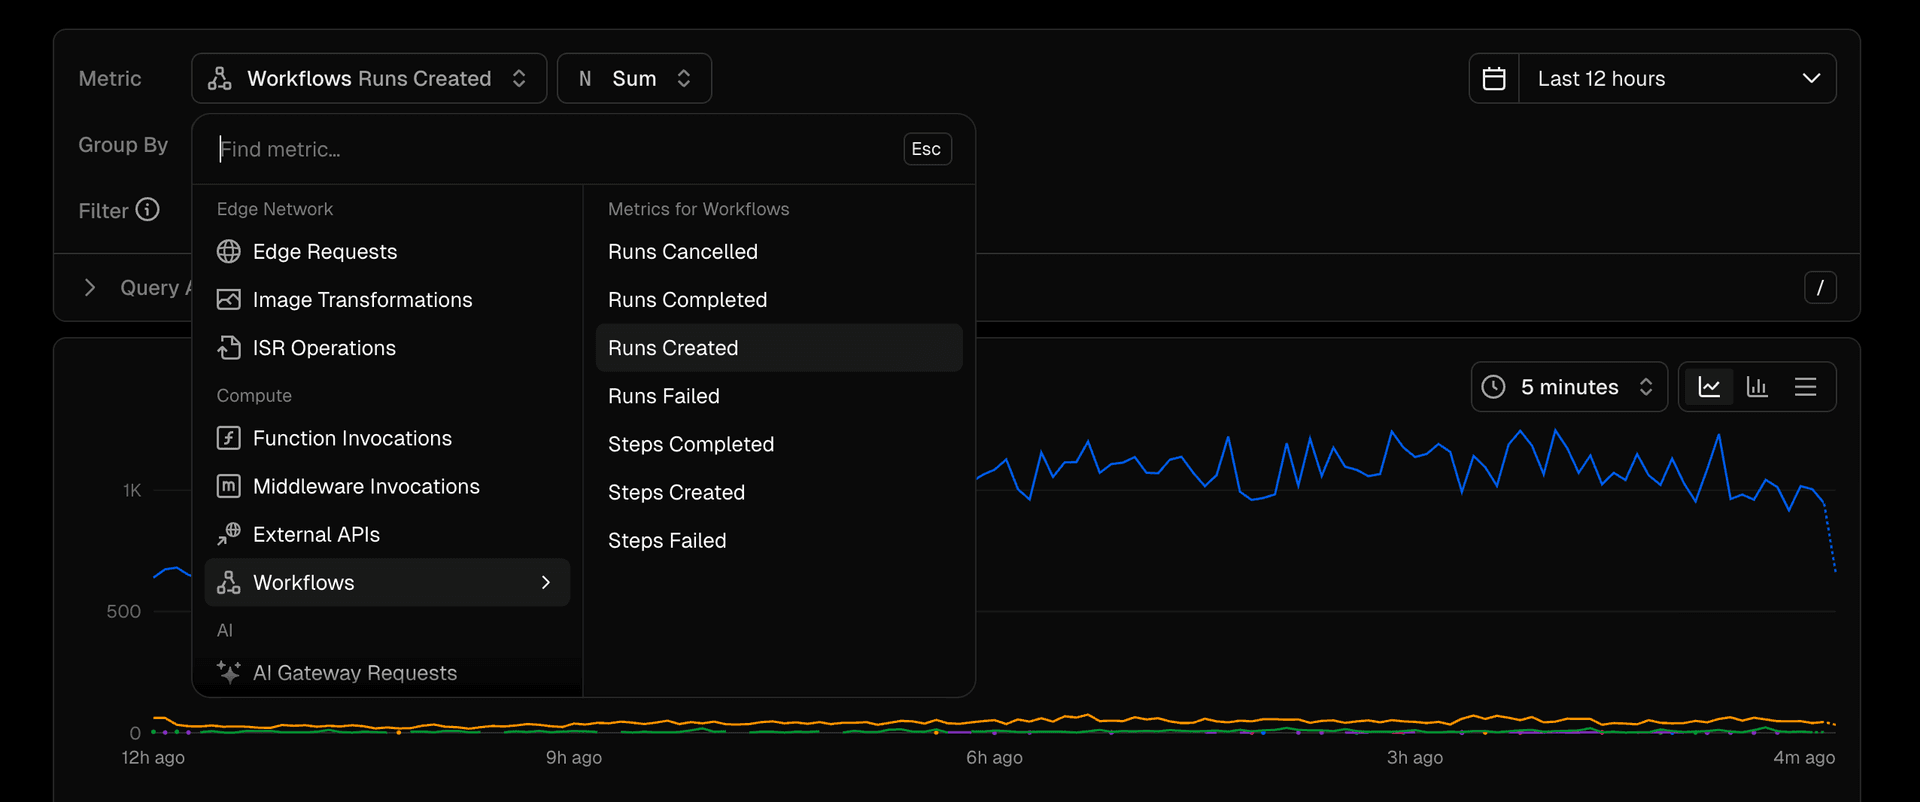
Observability Plus的查询构建器现支持用户自定义查询,以可视化Vercel Workflows中的流量、性能及其他关键指标。
我们取消了Observability Plus的10美元基础费用,仅按收集的可观察事件收费。该服务提供全面的数据可见性、增强日志、异常警报、30天日志保留和快速调试上下文。
As adoption of Kubernetes autoscalers like Karpenter accelerates, a new set of platform-agnostic observability practices is emerging, shifting focus from traditional infrastructure metrics to...
Moving from Ops Insights/Database Management to OCI Monitoring and Unified Log Analytics OCI is updating the recommended approach for observing MySQL HeatWave. This includes changes to existing...
At QCon London 2026, Colin Douch discussed building and operating self-hosted monitoring stacks, surveyed the current tooling landscape, and explained how to build a coherent observability setup...
Prasanna Vijayanathan and Renzo Sanchez-Silva, both Engineers at Netflix, presented “Ontology‐Driven Observability: Building the E2E Knowledge Graph at Netflix Scale” at QCon London 2026, where...
Colsubsidio通过Elastic Observability统一了40多个关键业务流程的日志、指标和事件,实现实时监控,MTTR减少30%,关键事件减少95%。该平台提升了服务可用性和用户体验,支持超过一百万用户。
随着微服务在Kubernetes应用中的广泛部署,网络监控变得更加复杂。Amazon EKS推出了Container Network Observability,提供网络性能监测和流量分析,帮助用户优化应用性能和排查问题。
微服务中的可观测性至关重要,需要通过指标(如QPS、延迟)和追踪(如OpenTelemetry)进行系统监控。关键指标通过接口暴露,追踪上下文需手动传递,以便准确定位请求瓶颈。
Vercel Agent调查已纳入Observability Plus,每个计费周期增加10项调查,无需额外费用,帮助团队快速诊断和解决事件。团队可购买额外调查信用,目前为Pro和Enterprise团队的公开测试版。
谷歌云工程师已启用Google Cloud Observability,支持OpenTelemetry协议(OTLP),简化追踪数据传输。用户可通过OTLP API发送追踪数据,减少对特定供应商导出器的依赖,确保数据标准化和互操作性。OTLP集成提升了监控效率,尤其在多应用或微服务环境中。尽管日志和指标的OTLP支持仍在开发中,谷歌云致力于简化遥测管理,促进开放云环境。
完成下面两步后,将自动完成登录并继续当前操作。