
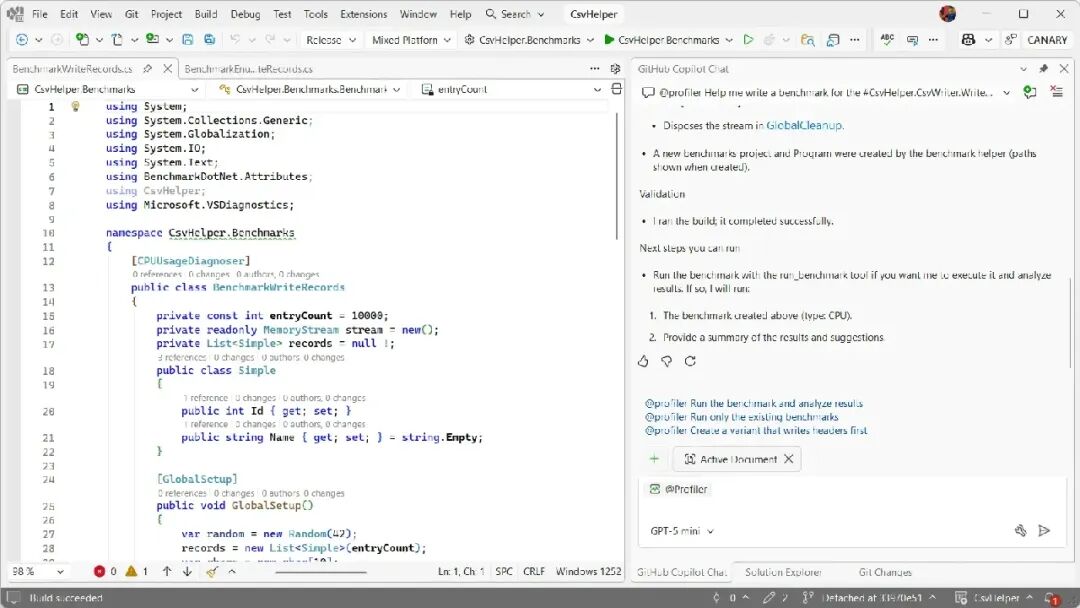
【译】Copilot Profiler Agent —— 分析任务交由 AI,应用性能不受影响
dotNET跨平台
·
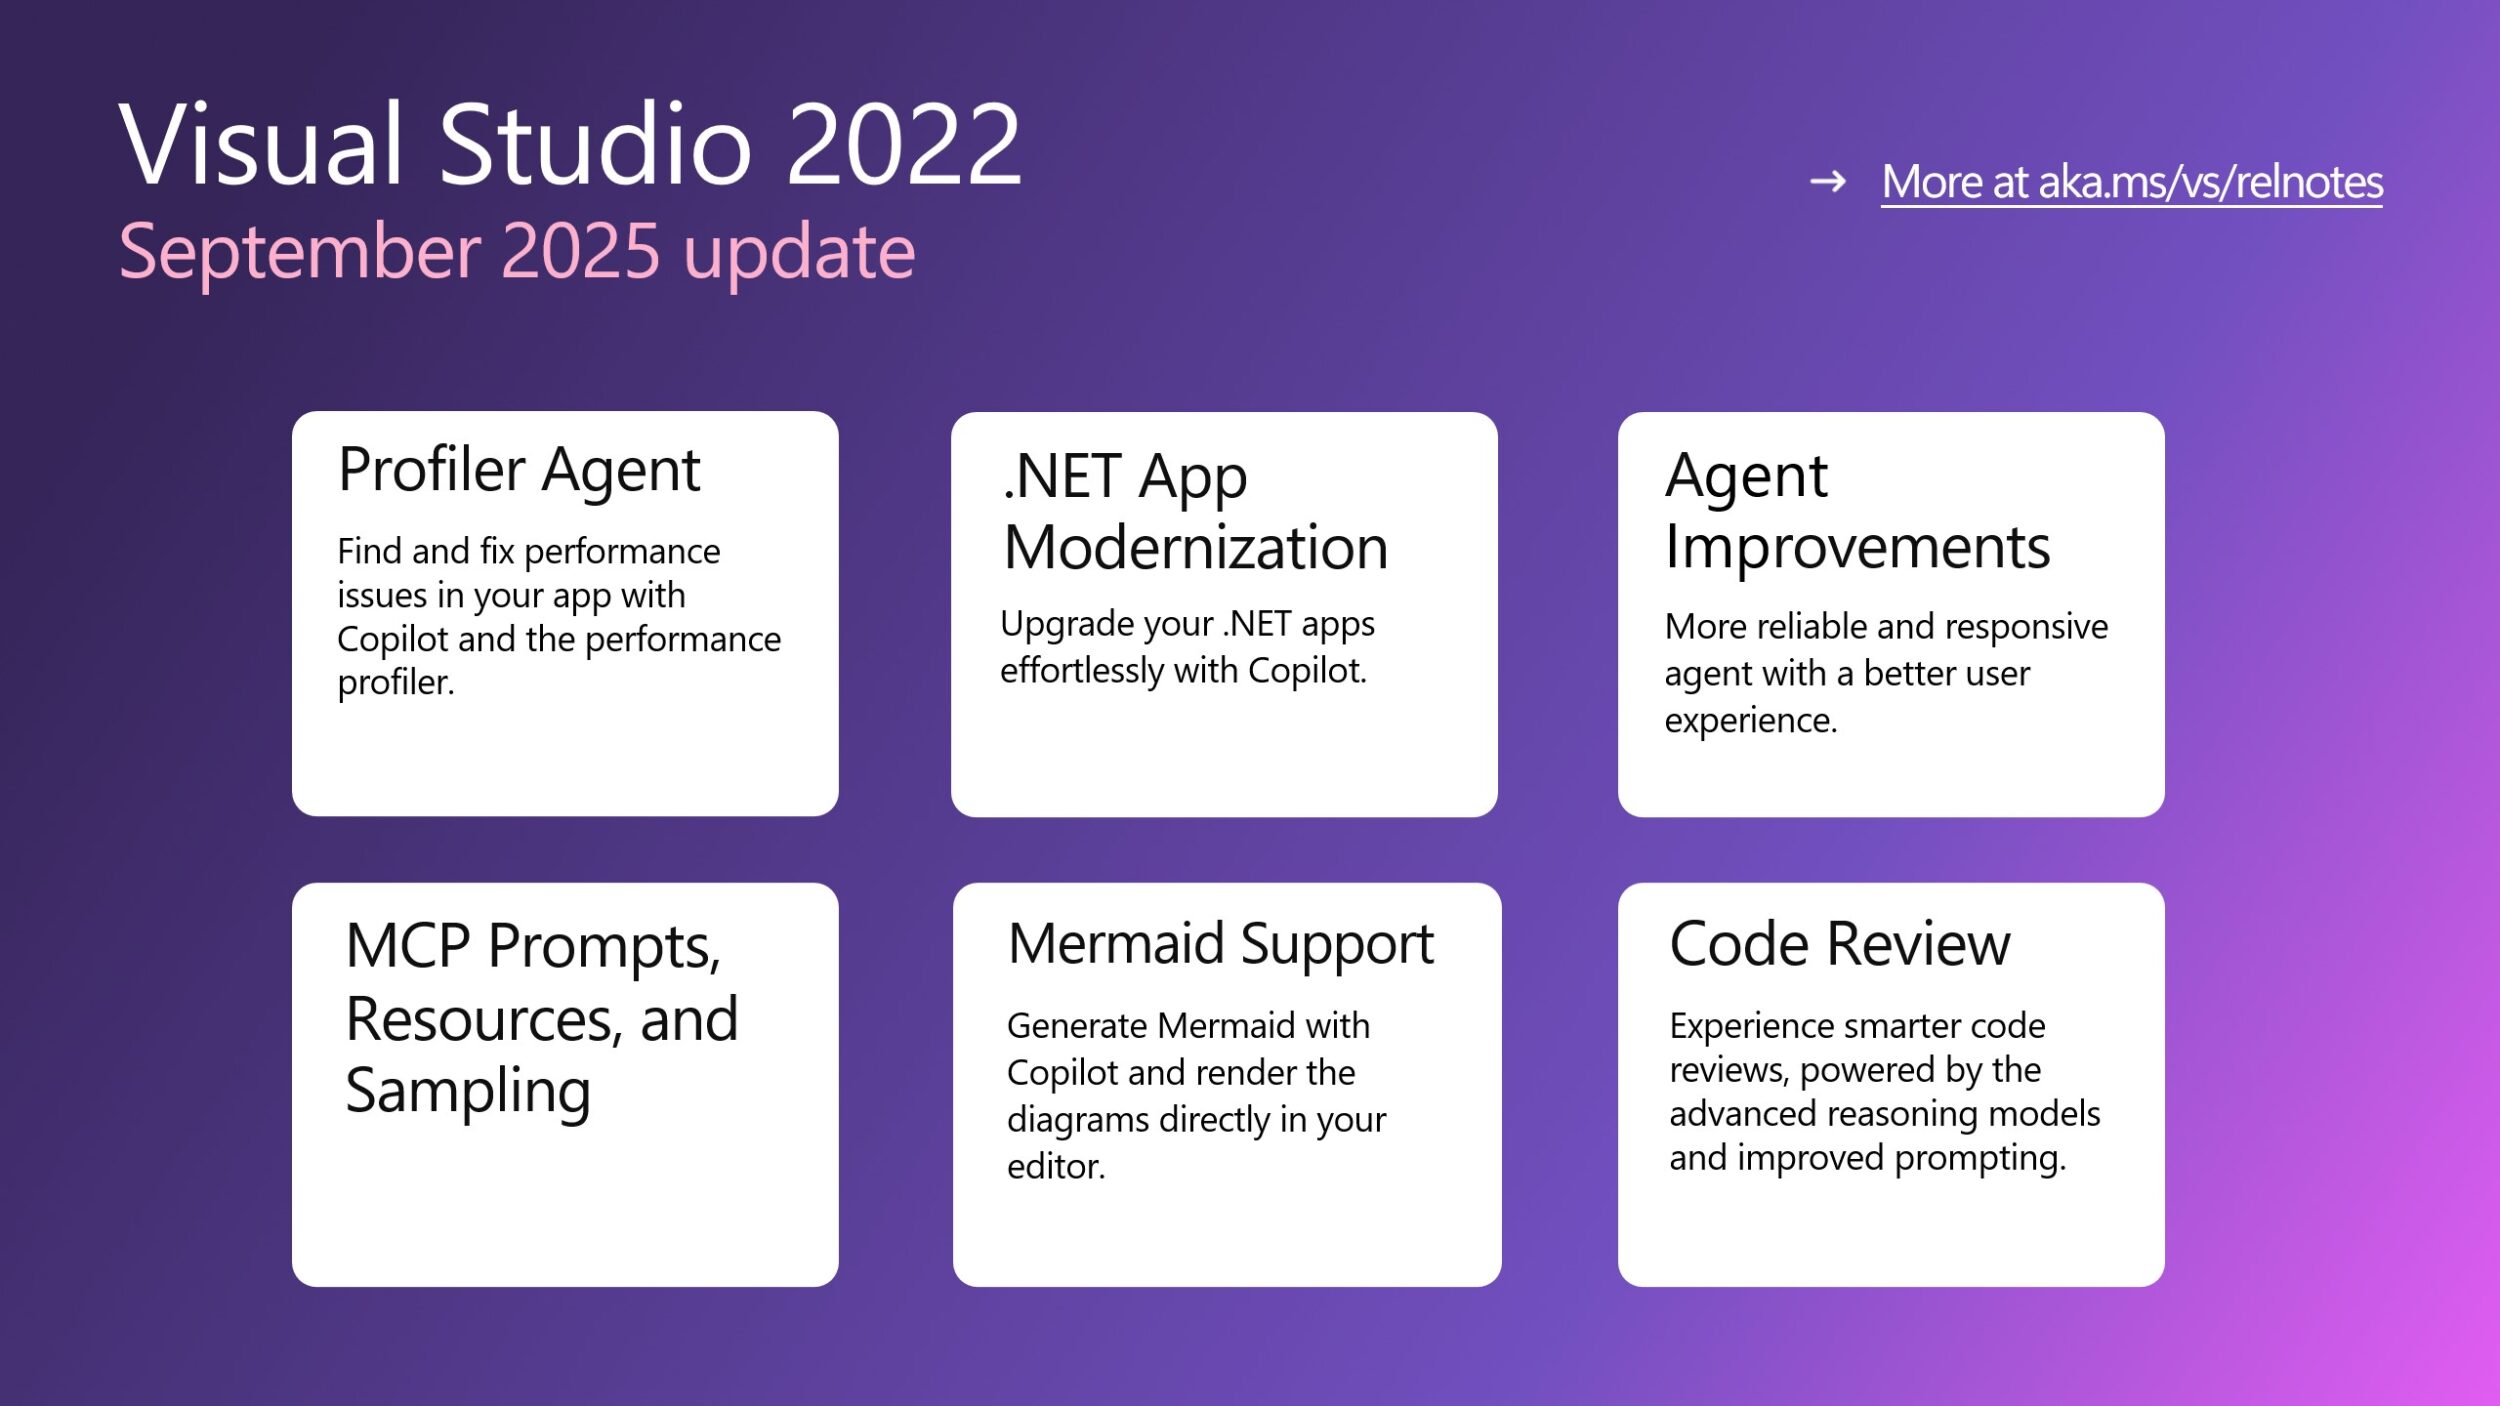
Visual Studio 九月更新 – Profiler Agent、应用现代化及更多功能
Visual Studio Blog
·

【译】让性能民主化:Copilot Profiler Agent 在实际代码中的应用
dotNET跨平台
·

为什么你的React应用会变慢(以及如何像专业人士一样修复它)
DEV Community
·

Rails 性能分析工具 rack-mini-profiler 和 bullet
Frytea's Blog
·


利用 Node.js Profiler 改善程式效能
DEV Community
·

DBMS_PROFILER详细解析及其步骤
DEV Community
·

EXPLAIN PLAN与DBMS_PROFILER解析
DEV Community
·
