


杰夫·贝索斯的AI初创公司旨在打造“通用人工工程师”
The Verge
·
![[MAF预定义ChatClient中间件-08]OpenTelemetryChatClient-实现链路跟踪和性能监控 - Artech](https://img2024.cnblogs.com/blog/19327/202606/19327-20260612082522349-1749340816.png)
Kubernetes集成税:Prometheus、Cilium与生产现实
Cloud Native Computing Foundation
·
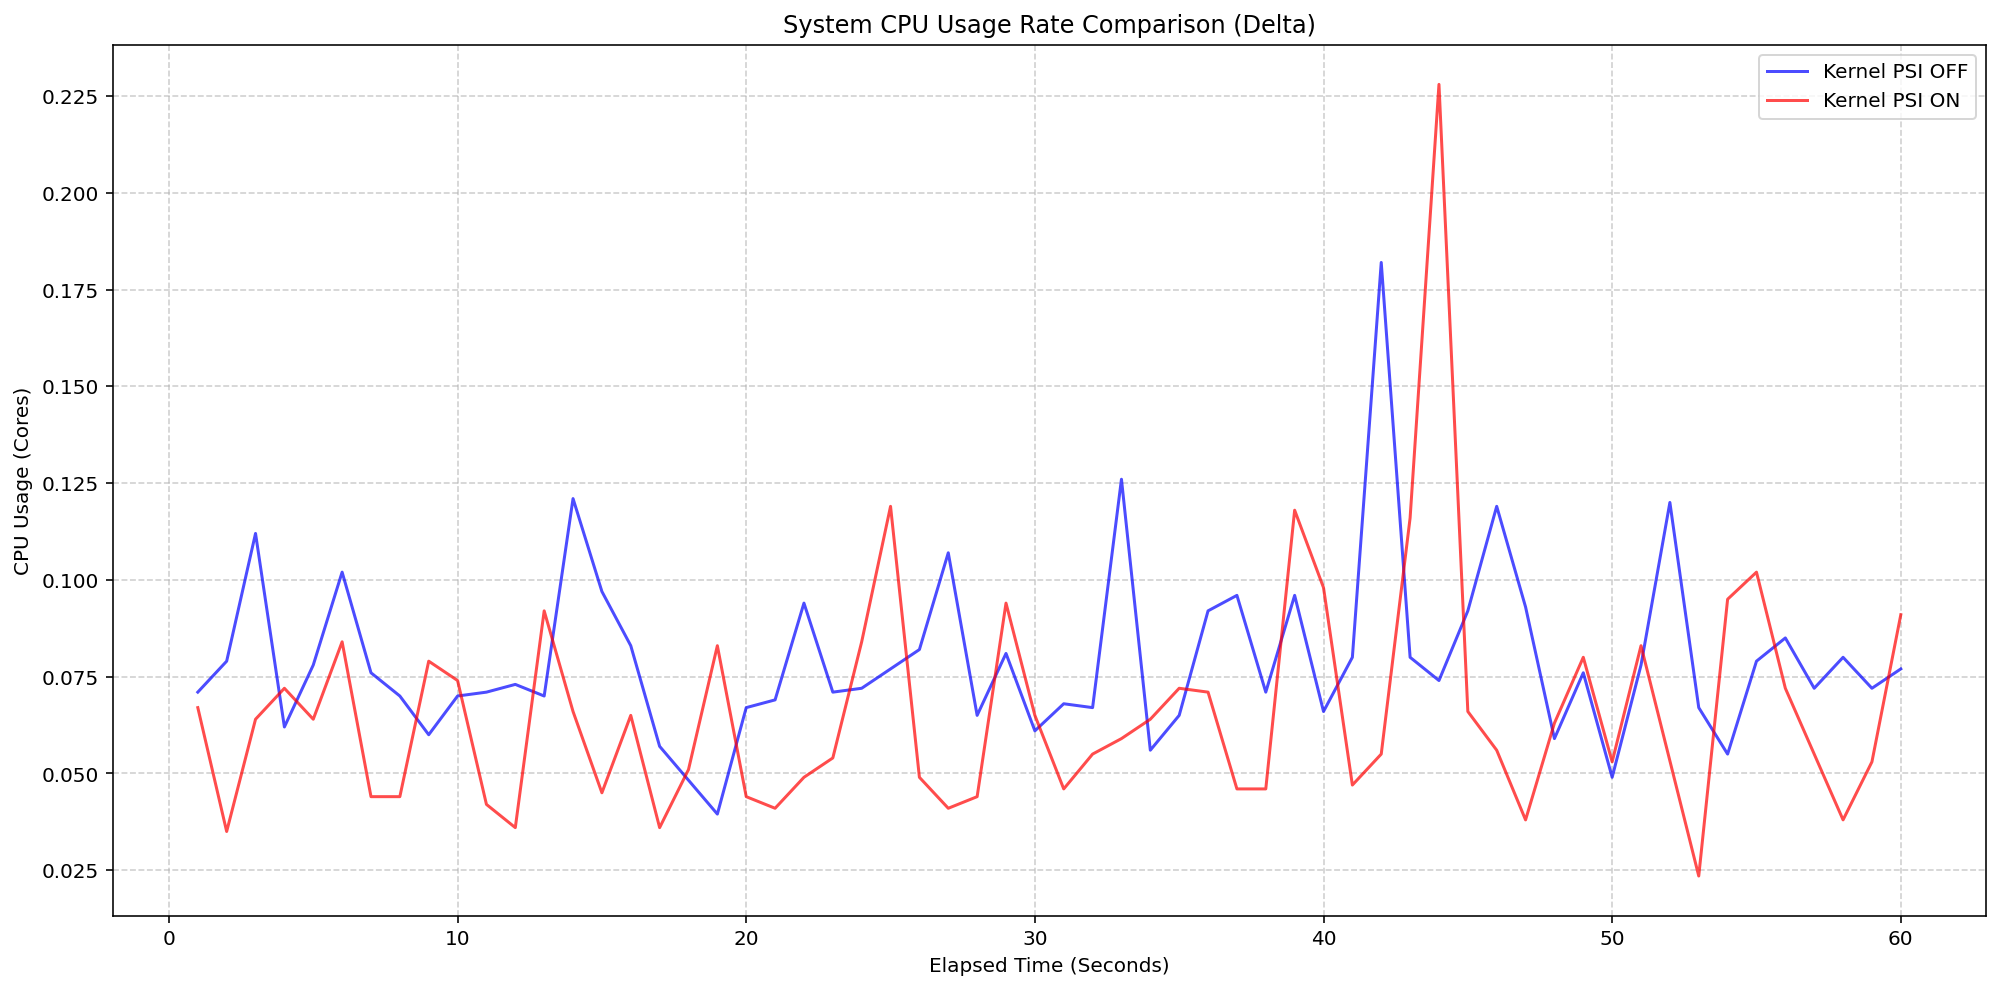
Kubernetes v1.36:PSI指标正式发布
Kubernetes Blog
·
为什么Prometheus在凌晨2点无法看到Cilium指标
The New Stack
·
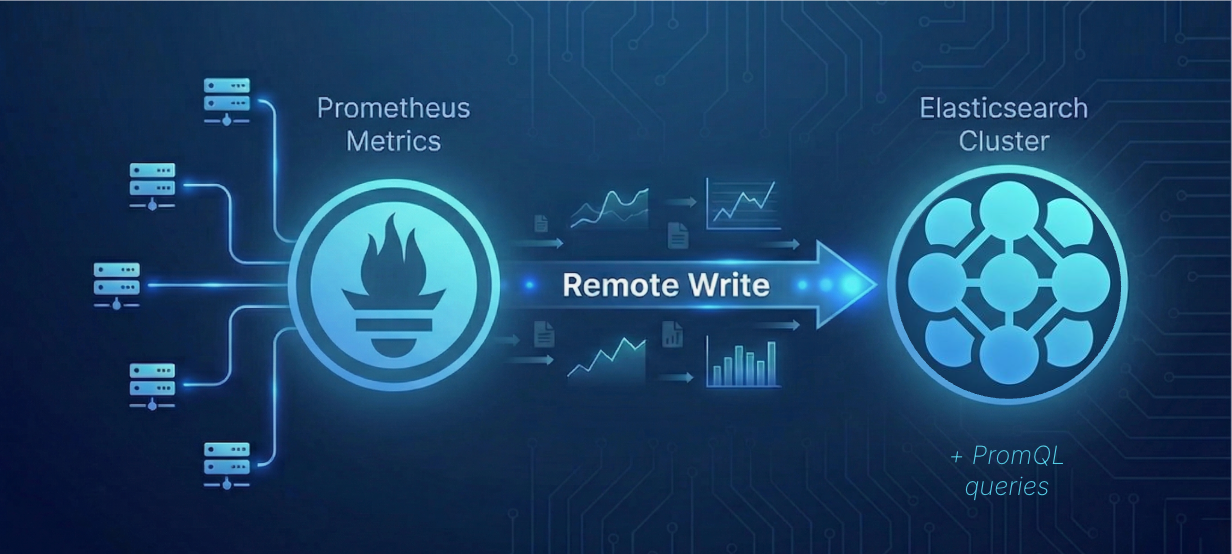
Elastic 9.4:Workflows正式发布、Agent Builder更新及Prometheus/PromQL支持
Elastic Blog - Elasticsearch, Kibana, and ELK Stack
·
从定制到开放:使用Prometheus实现可扩展的网络探测和HTTP/3准备
Slack Engineering
·
KubeCon + CloudNativeCon 欧洲 2026 联合活动深入探讨:观察日
Cloud Native Computing Foundation
·

可观察性平台迁移指南:Prometheus、OpenTelemetry 和 Fluent Bit
The New Stack
·

OpenTelemetry路线图:未来的采样率和收集器改进
The New Stack
·

Prometheus与OpenTelemetry终于和谐共处
The New Stack
·

构建Prometheus:后端聚合如何支持千兆瓦级AI集群
Engineering at Meta
·
