
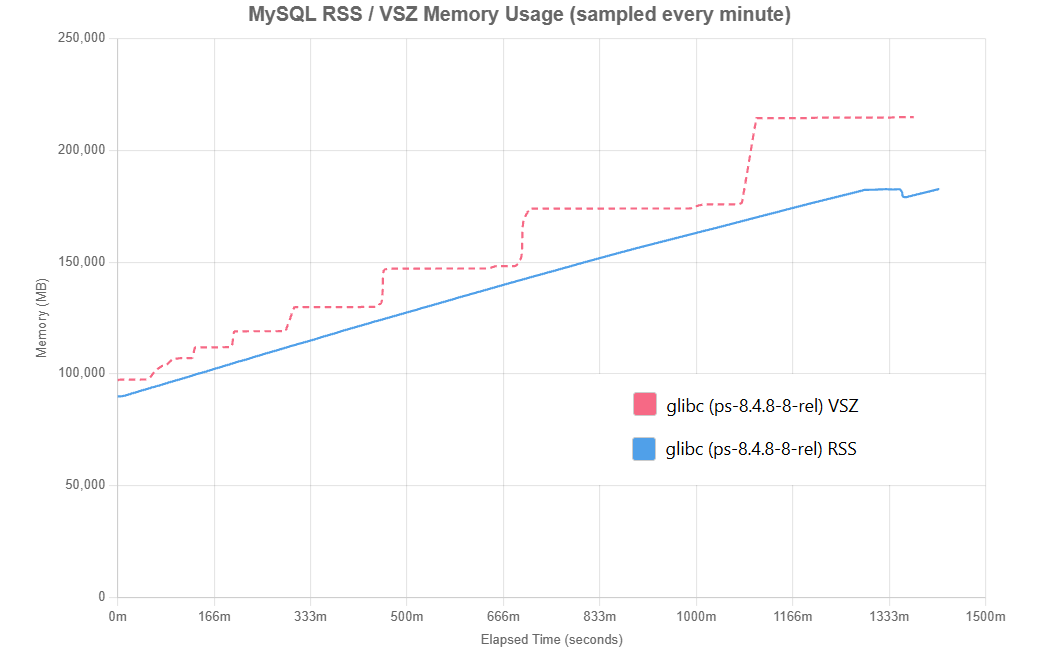
Stored Procedures memory consumption in Percona Server for MySQL
Percona Database Performance Blog
·
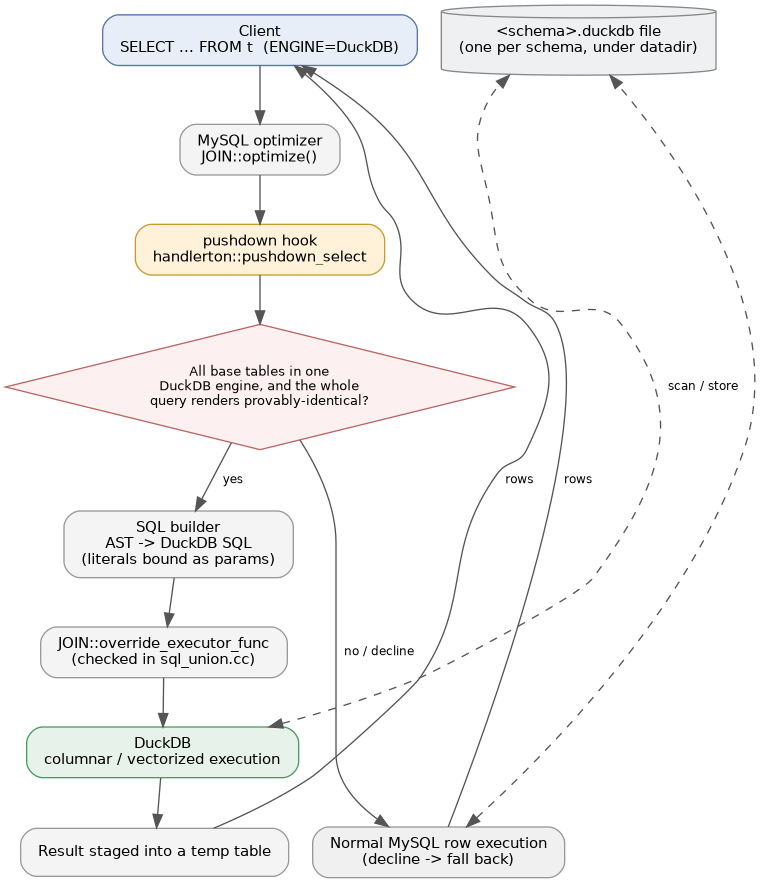
将DuckDB作为MySQL 9.7存储引擎运行
Percona Database Performance Blog
·
MySQL 1.2.0的Percona操作员:跨站点复制、加密备份和自动存储扩展
Percona Database Performance Blog
·
仍在使用MySQL 5.7或8.0?那些高严重性CVE修复已被涵盖
Percona Database Performance Blog
·


在MySQL中切换到JSON错误日志记录
Planet MySQL
·
